
| 22 Creative Uses of Robots in Web Design | 10:31 PM |
|
comments (1)
Filed under:
|
|
Simply put… robots are awesome. Using robots in a web layout adds a touch of unique and futuristic feel to it. In this imaginative showcase, you’ll find creative applications of robotic elements in web design.
1. Suponix

2. DerekAllard.com

3. web.burza

4. Idea Foundry

5. Mercedes-Benz Pro-Safe

6. FunnelDesignGroup

7. ECTOMACHINE

8. Recycled Lifeforms

9. WowWee

10. ROBOT UPRISING

11. Blue Flavor

12. Sitening

13. Sushi & Robots

14. Made In Space

15. Iconfinder

16. PixelLab Interactive

17. XHTMLized

18. ROBOT 44

19. WiredThing

20. BioShock

21. Object Adjective

22. Instinct

Moar Robots?
Do you know of other websites that use robots in their design? If so, share it in the comments because I love robots.

| JavaScript Debugging Techniques in IE 6 | 7:18 PM |
|
Filed under:
|
|
Microsoft’s Internet Explorer 6 is almost universally hated by web developers. It’s hard to work with and support, but with a few solid techniques, you can make the process less painful. What “just works” in the majority of browsers will almost always require hours of tweaks and workarounds to get it working in IE6. With more and more users switching over to newer alternatives such as IE8, Safari and Firefox hopefully support for IE6 can be dropped sooner rather than later. In the mean time though many of us have to make sure our sites work in this awful browser.

To make things worse, IE6 is extremely bad at helping developers diagnose problems. When a JavaScript error occurs, IE6’s default behaviour is to display a small error icon in the status bar. Extremely easy to miss!

Double clicking on this icon will display a popup, and if you then click the “Show Details” button you’ll get the actual details of the JavaScript error. Unfortunately the detailed error message can be quite cryptic, and probably not too much help in diagnosing the actual problem. Your best bet is to make a note of the line and column number of the problem and then look that up in the source code. Fortunately, with the help of Visual Studio and by changing a few IE settings, we can make it much easier on ourselves.
Setting things up
To enable JavaScript debugging in IE we need to change some default settings, which can be accessed from the Tools> Internet Options menu, and then the Advanced tab. The image below shows the default IE6 settings, with the three settings we’re interested in highlighted.

Script debugging in IE needs be enabled, which requires us to disable the first option out of the three. If you also want to debug scripts in other contexts (such as Outlook) then disable the second option. Enable the third option if you’d like the JavaScript error dialog to pop up automatically instead of being displayed as a small icon in the status bar.

After changing those settings and restarting IE, we’re ready to start debugging. All of the following examples show Visual Studio 2005, but the same applied to 2008. You can also use the free Web Developer Express Edition if you don’t own a full copy of Visual Studio. Instead of IE prompting you to open the debugger, as it does in the examples below, you’ll first need to create a project and then start the debugger yourself. From that point on everything is the same.
Basic debugging
Let’s start with a simple example. The code below tries to call a function that doesn’t exist:
Now when we load that up into the browser instead of the tiny icon in the status bar IE will prompt us to open a debugger.

Selecting Visual Studio and clicking the yes button will open Visual Studio and highlight the code that is the cause of the problem.
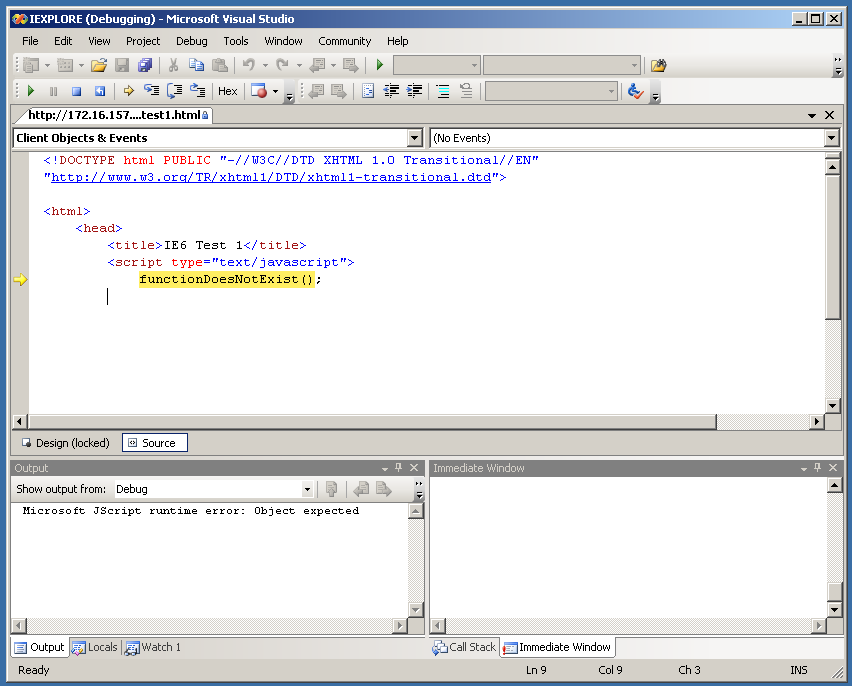
For relatively simple errors, such as the one in the example above, just seeing the actual cause of the error highlighted is probably enough for us to work out what has gone wrong, and how to fix it. In more complex cases, however, we’ll need more information. This where the Visual Studio debugging features come in really handy.
In the code below we have a function, performAction, which takes a function as an argument and calls that function once it’s done. You’ll commonly see this sort of thing in JavaScript with asynchronous functions such as setTimeout and jQuery’s Get. There is a problem with the code below though: We’re accidentally passing in a string to performAction rather than a function.
If we load up the code in IE and then debug it in Visual Studio as we have before we’ll see that the code “callback();” is highlighted, and is therefore the cause of problem. It won’t be obvious why this line is causing the problem though, not unless we know what the value of callback is. If callback was actually a function then there wouldn’t be a problem at all. The problem has only arisen because we accidentally passed in a string. This is where the “locals” window comes in handy. It lists all local variables along with their value and type. To display this window go to the Debug menu, then Windows, and then select Locals.
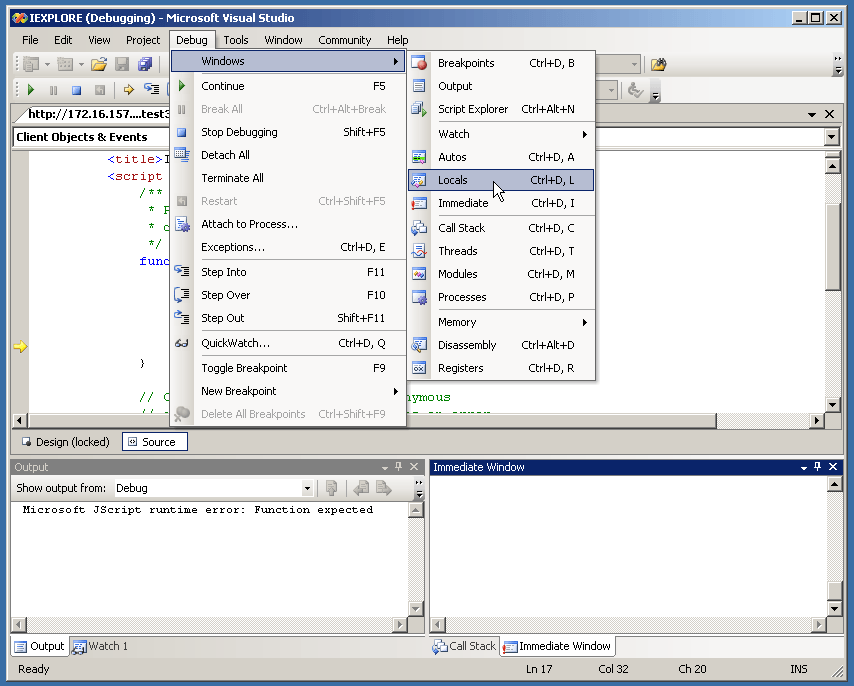
With the locals window displayed it’s clear that the problem is that callback is a string, rather than a function. The locals window doesn’t just support basic types such as integers and strings. If you’ve got a local object you can look at all of its properties and see the value and type of each of them, as we’ll see in the next example.

The ‘debugger’ keyword
The ‘debugger’ keyword, also supported by the Firefox JavaScript debugger Firebug, can really help us to track down problems. Below is a slightly modified version of the previous example, where this time the callback function is passed an object that should include a status and message property. The message property has been misspelled though:
Because ‘message’ has been misspelt as ‘mesage’ in the performAction function when we run this code in IE we’ll see a popup alert with the message “undefined”, rather than the actual message we were hoping to see.

In a large project it can be difficult to track down why a property we expect to exist is undefined. Instead of trawling through lots of code we can simply add the line “debugger;” above the alert statement. IE will then automatically prompt us to debug the code in Visual Studio when it hits that line. From the locals window we can see that the ‘message’ property has been misspelt.
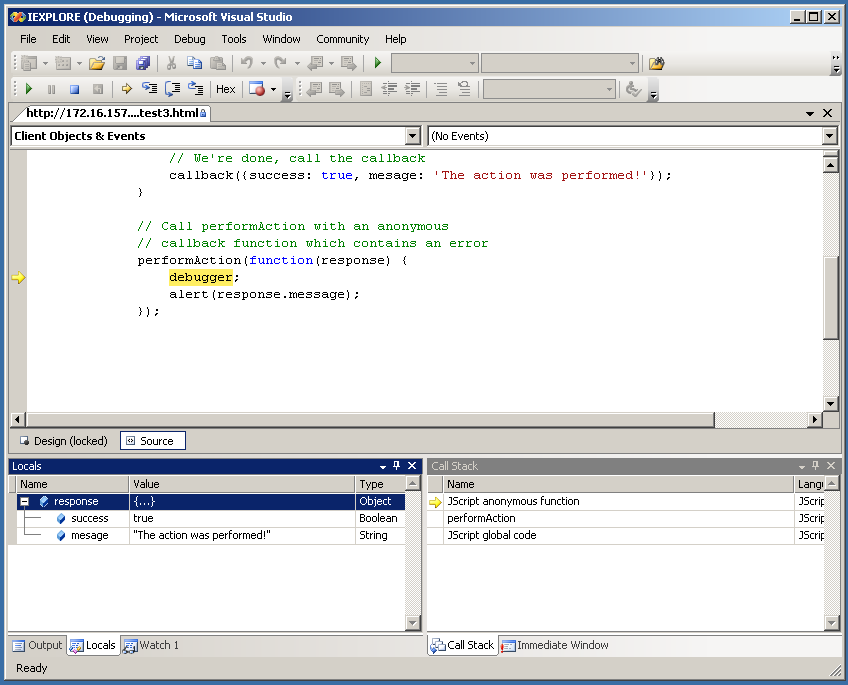
Using the call stack window, which can be accessed in the same way we accessed the locals window, shown at the bottom right of the above screenshot we can work out exactly where this problem occurred. If we double click on the ‘performAction’ line, the previous statement in the call stack, we’ll see the source of the error.
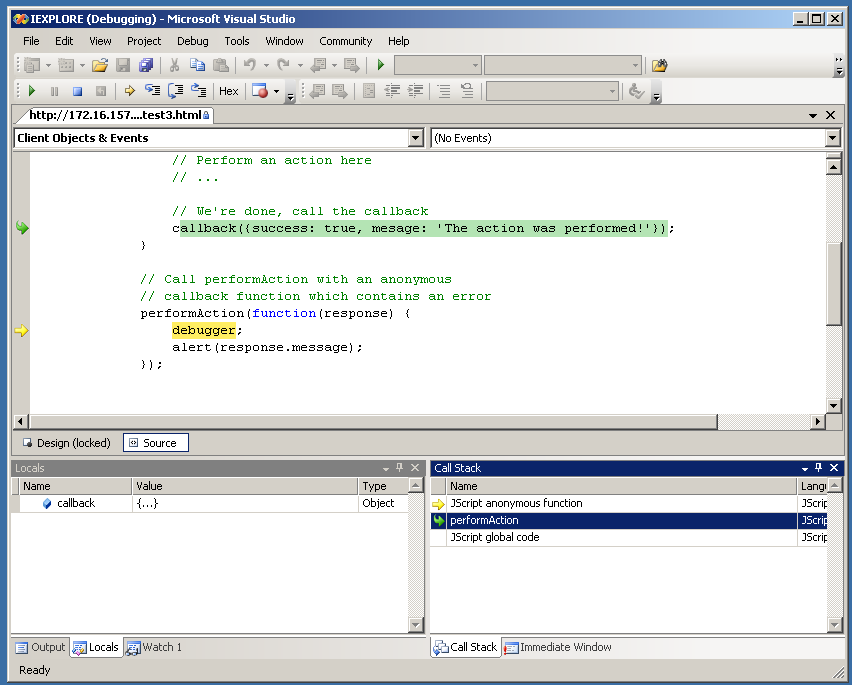
While debugger statements can be a useful tool in helping you track down problems you should be careful not to leave them in your production code!
More advanced debugging
So far we’ve covered some basic examples, such as calling non-existent functions and undefined properties. Using the locals and call stack windows it was relatively straight forward to track these issues down. There are times when the techniques we’ve discussed so far can’t help though. We can’t see what global variables exist or what value they have with the locals window, for example, and the call stack doesn’t always handle remotely loaded or dynamically executed code very well.
For these situations we must turn to the immediate window. It is by far the most powerful debugging tool that Visual Studio has to offer, allowing us to evaluate JavaScript expressions on the fly.
The immediate window can be accessed in the same way that we accessed the other windows. Clicking inside the window will give it focus. We can then type JavaScript statements directly into the window and see the result. For example, type “window” followed by enter and you’ll get a print out of everything in the global scope.

When combined with the JavaScript arguments variable we can look in detail at all the current function arguments and the calling function. While the code in the next example isn’t something you’re likely to see in a real project, it does help to demonstrate techniques that can be extremely useful.
We’ll load this up into IE and then go straight to the immediate window once we’ve opened up the debugger. If we type “arguments” followed by enter we’ll see the following information displayed:
arguments
{...}
    [0]: "argument 1"
    [1]: 2
    [2]: {...}
    caller: null
    length: 4
The “{…}” tells us that arguments is an object. We also see this next to [2], so we know that the third argument (in array position 2) is an object. We can see what properties this object has by simply typing its name into the window:
arguments[2]
{...}
    argument: 3
The fourth argument wasn’t listed in the original output because it’s a function. We know it exists though because the length property tells us that there are 4 arguments. We can also confirm it is there using typeof:
typeof arguments[3]
"function"
Unfortunately the immediate window isn’t quite so helpful with functions as it is objects, and if we type in the name of the function we just see “{…}” rather than any details of the function itself. Fortunately there is a handy workaround. If we type “alert(arguments[3]);” then the function code will be displayed in an alert dialog:

Hopefully these examples have conveyed just how powerful the immediate window is.
| Make High-Impact Backgrounds for Your Designs with Photoshop | 9:48 PM |
|
Filed under:
|
|

In this Photoshop web design tutorial, you’ll learn about creating dynamic and high-impact backgrounds that you can use on your own web layouts. We’ll go over color/gradient techniques, lighting effects, and using textures and patterns.
Introduction
When visually designing websites, the little things are what make a design stand out. In this tutorial, I’ll show you a few ways to enhance the way your website looks. We will also look at some examples of people that have applied each one or a combination of these techniques.
Colors/Gradients
Gradients are great if used correctly. For the most part, when you are designing a website with gradients, you should use subtle color variations. Colors and gradients can really give your website more dimension and make it pop.
Let’s start with some experimentation.
Linear Gradients
Let’s begin with the basics: linear gradients. When choosing a gradient, a good practice is to use two colors that aren’t high contrast to each other, but enough so that the effect is still obvious.
We’ll use a dark blue hue. (R:10 G:34 B:55).
Click and drag down the linear gradient from the top of the header, down. This gives a subtle change that helps give the design a bit of "oomph".

Here are some examples of websites that use linear gradients:
Ballpark

Spundo

Dermapure

Radial Gradients
Next up are Radial Gradients. Choose the Gradient Tool (G) and pick the Radial Gradient option.
Click and drag a small gradient in the middle of the document (we are going to resize it).

Bring the gradient to the top of the document.
Use Edit > Free Transform (Ctrl + T), then use the Transform Controls to stretch out the radial gradient so the gradient reaches the edges of your website. Then move it using the Move Tool (V) so the middle of the gradient is at the very top of the document.

Here are a few examples of websites that use radial gradients:
Webdever

Pixeloop Media

Classic Clutch Australia

Color
Much like with the gradient, you can make your website pop by using a unique color. Sticking with our blue, we can change the entire website to this color. The only other thing I changed was the background color of the posts to give it a better contrast.

We can also do a combination of both the color and gradient.

Here are some examples of websites that use solid colors:
For A Beautiful Web

Guifx

Lighting Effects
This is much like the gradients, but with a little more variation in color.
To achieve this effect, start with a white background and go into Filter > Render > Lighting Effects.
Change your settings to something like what I have in the figure below.

You can play around with the different settings, but the important thing to remember is that the top color is going to be the color you want to see, and the bottom color needs to be black. Change the Blend Mode to Screen. Repeat this step twice, changing colors to different shades of blue, making them smaller and moving it to the left and right sides of the document.
The more you change the color, the more dynamic your background will be.

Here are a few examples that use lighting effects:
GreenLite Web Solutions

levon.co.za

RedoPC

Textures/Patterns
Textures and patterns can give your website that little something extra to make it truly stand out. They can give your website more detail that you just can’t get out of simply using gradients and lighting effects. They can also help to change the mood and look of your website depending on what textures or patterns you decide to employ.
Textures
For this example, we’re going to use a stock texture from Unsigned Design; here is the texture file link: IMG_1283.JPG.
Bring it into your Photoshop document, and resize it using Edit > Free Transform (Ctrl + T) so that it spans the entire document. Now we are going to adjust the stock texture to darken it so it goes better with the black background. Open up the Levels Adjustment, Image > Levels > Adjustments… (Ctrl + L) and adjust the arrows so there is no open space on the left side of the graph.

Now open up the Curves Adjustment dialog, Image > Adjustments > Curve… (Ctrl + M) and adjust the settings to something similar to the figure below, keeping in mind that we want to have a texture that will blend well with the background.

Let’s get rid of the hard edges so we have a smooth transition to our solid color. Make sure you are on the texture layer and add a layer mask by clicking on the Add Layer Mask icon at the bottom of the Layers palette.
Select the linear gradient from the toolbar, and with black (#000000) as your foreground color, click and drag a gradient on the left and right sides of the document, as well as the bottom of the image to the bottom of the header to give it a smooth transition.


Here are some examples of good uses of textures:
2009 Sanjoaninas

Explovent

Revive Africa

lebloe

Patterns
I’m not going to show you how to create the patterns, but if you want to learn how to, you can go check out this tutorial I wrote called "Create an awesome background using patterns".
Lets take a look at how to add patterns to our design.
I am going to take the carbon fiber pattern from the tutorial I referenced above. We want to do the same kind of masking that we did with textures, but first let’s start by using your Rectangular Marquee Tool (M), then creating a box selection across the top of the document and filling it with our pattern.

Drop the opacity of the layer down to around 20% and mask the edges similar to the method we used in the textures section above.

We can mix it up with either of the textures or patterns by adding any of the gradient or lightings techniques to it as well.

Here are some good examples of websites that use pattern:
ILLUSIO

Gabriel Nunes

Danny Diablo

